

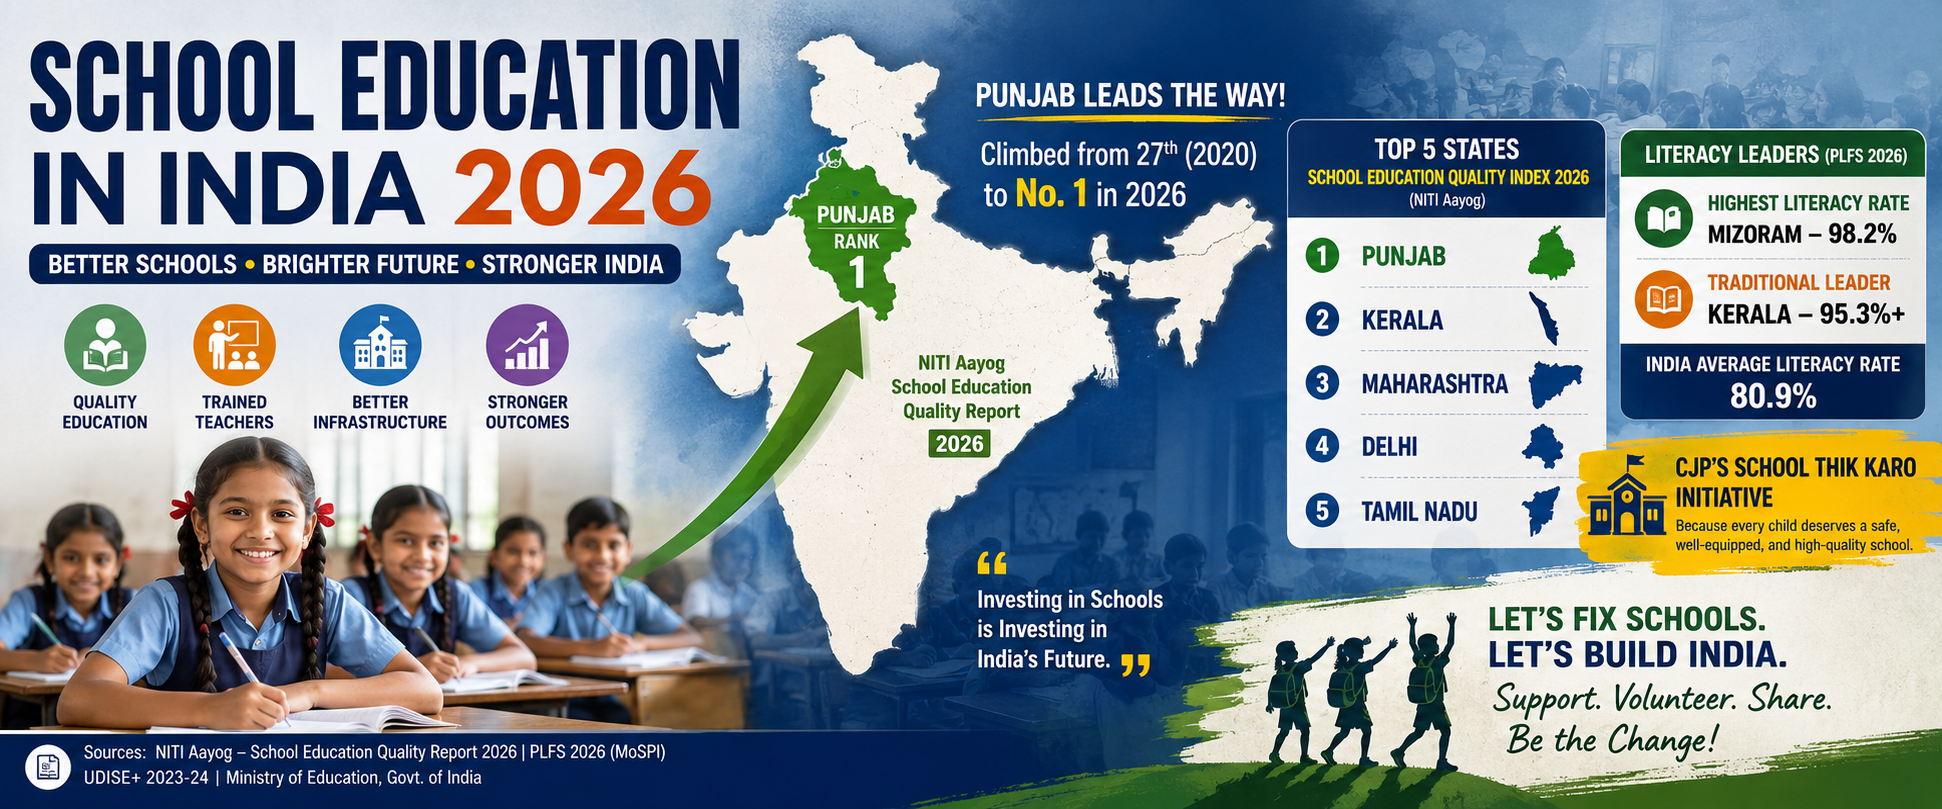

From Punjab’s claimed rise from 27th to No. 1 to Mizoram’s 98.2% literacy rate, India’s education story is full of contrasts. The real question is not which state has won a ranking, but whether every child—especially in a government school—has access to a good teacher, a functional classroom and the ability to actually learn.
India has never had as many children inside the school system as it does today. Yet the country’s education story is increasingly becoming a story of two Indias: one where government schools are being transformed with smart classrooms, laboratories and specialised programmes, and another where schools still struggle with teachers, low enrolment, inadequate infrastructure and weak foundational learning.
The latest government datasets make this contrast impossible to ignore.
And Punjab’s recent performance has made the debate even more interesting.
First, a clarification about the much-publicised “Punjab No. 1” claim
Several reports in June 2026 said Punjab had moved from 27th position in 2020 to first place in school education, ahead of Kerala, Maharashtra and Delhi. The Punjab government and political leaders attributed the transformation to investments in government schools, teacher recruitment and training, infrastructure and learning outcomes.
But there is an important data caveat.
The official NITI Aayog publication released in May 2026 is titled “School Education System in India: Temporal Analysis and Policy Roadmap for Quality Enhancement.” It is a broad research and policy report—not a document titled “School Education Quality Report 2026” containing a single official all-state league table. NITI itself says the report is an independent academic and policy-oriented study and that its conclusions do not necessarily represent the views of NITI Aayog or the Government of India.
The earlier School Education Quality Index (SEQI) was indeed launched by NITI Aayog in 2019.
Therefore, the safest interpretation is this:
Punjab has made a very strong improvement on several current school-education indicators, and the Punjab government has described the latest NITI Aayog evidence as a No. 1 performance. But “Punjab is officially ranked No. 1 overall by a 2026 NITI league table” should not be presented without this qualification.
That distinction matters because education cannot be reduced to one number.
The bigger picture: India has 14.71 lakh schools
According to UDISE+ 2024-25, India had approximately:
- 14.71 lakh schools
- 24.69 crore students
- 1.01 crore teachers
- Around 69% of schools were government schools
- Government schools accounted for about 49% of total enrolment
- Private schools accounted for about 26% of schools but 41% of students.
This is perhaps the most important fact in the entire education debate.
Government schools are still the backbone of Indian education.
They educate millions of children who cannot—or do not want to—depend on private schooling.
So when a government school deteriorates, it is not merely a building that deteriorates.
It is a child’s opportunity.
Literacy: Mizoram beats Kerala, but the regional divide remains huge
The latest official PLFS data available for comparison is 2023-24, not a separate “PLFS 2026” literacy survey.
For people aged 7 years and above, rural and urban combined, India’s literacy rate was 80.9%.
But the state-wise differences are enormous.
Literacy rate across Indian states — PLFS 2023-24
| State | Literacy % |
|---|---|
| Mizoram | 98.2 |
| Nagaland | 95.7 |
| Kerala | 95.3 |
| Meghalaya | 94.2 |
| Tripura | 93.7 |
| Goa | 93.6 |
| Manipur | 92.0 |
| Himachal Pradesh | 88.8 |
| Assam | 87.0 |
| Maharashtra | 87.3 |
| Tamil Nadu | 85.5 |
| Sikkim | 84.7 |
| Haryana | 84.8 |
| Gujarat | 84.6 |
| Arunachal Pradesh | 84.2 |
| Uttarakhand | 83.8 |
| Punjab | 83.4 |
| Karnataka | 82.7 |
| West Bengal | 82.6 |
| Jammu & Kashmir | 82.0 |
| Odisha | 79.0 |
| Chhattisgarh | 78.5 |
| Uttar Pradesh | 78.2 |
| Telangana | 76.9 |
| Jharkhand | 76.7 |
| Rajasthan | 75.8 |
| Madhya Pradesh | 75.2 |
| Bihar | 74.3 |
| Andhra Pradesh | 72.6 |
All-India: 80.9%.
The difference between Mizoram and Andhra Pradesh is an astonishing 25.6 percentage points.
That is not merely a statistical difference.
It represents differences in schooling access, household conditions, geography, gender inequality, teacher availability and the quality and continuity of education.
Literacy and school quality are NOT the same thing
This is where public debate often goes wrong.
Kerala’s 95.3% literacy rate does not automatically mean Kerala has the best score on every school-learning indicator.
Similarly, Punjab’s reported improvement in school-learning indicators does not mean Punjab has India’s highest overall literacy.
The latest NITI Aayog report’s PARAKH data illustrate this beautifully.
At the foundational Grade 3 stage:
| State | Language | Mathematics |
|---|---|---|
| Punjab | 82% | 78% |
| Kerala | 75% | 70% |
| Himachal Pradesh | 76% | 72% |
| Maharashtra | 69% | 64% |
| Uttar Pradesh | 68% | 64% |
| Madhya Pradesh | 66% | 62% |
| Rajasthan | 70% | 66% |
| Bihar | 56% | 54% |
| Jharkhand | 55% | 51% |
| India | 64% | 60% |
These are PARAKH 2024 Grade 3 competencies, not literacy rates.
This distinction is critical.
A child can technically be counted as literate while still struggling to understand age-appropriate text, solve mathematics problems or apply knowledge.
The next revolution in Indian education therefore has to be from “schooling” to “learning”.
Punjab: what appears to have changed?
Punjab provides an interesting case study because its current numbers are strong in several areas.
The latest UDISE+ data show:
- 27,281 schools
- 59.09 lakh students
- 2.73 lakh teachers
- Pupil-teacher ratio of about 22
- Average of around 10 teachers per school
- 2,431 single-teacher schools
- Around 76,942 students enrolled in single-teacher schools.
A detailed analysis of UDISE+ data also points to Punjab’s strong retention and infrastructure indicators, including a Class 12 retention rate of 67.8%, substantially above the national figure of 47.2%.
Punjab has also promoted:
- Schools of Eminence
- modernised government-school infrastructure
- digital classrooms and laboratories
- teacher and principal training
- specialised preparation for examinations such as NEET, JEE, CLAT and NIFT.
The state’s leadership has also highlighted training programmes involving institutions in Singapore, Finland and IIM Ahmedabad.
But Punjab is not a finished success story
The same UDISE+ dataset records thousands of single-teacher schools.
And ASER 2024 found that although Punjab was among the better-performing states in government-school Grade V reading, it also reported declines in some government-school indicators compared with earlier rounds.
So the lesson from Punjab should not be:
“Everything is fixed.”
The better lesson is:
“Focused policy intervention can produce measurable improvement—and that improvement must now be sustained.”
Kerala: why literacy still matters
Kerala’s strength is different.
Its 95.3% literacy rate remains one of India’s highest among states, according to PLFS 2023-24.
Its school system also performs strongly on learning outcomes.
NITI Aayog’s PARAKH data show Kerala at:
- 75% language competency
- 70% mathematics competency
at the foundational Grade 3 stage.
Kerala’s UDISE profile is also striking. It has only 63 single-teacher schools, compared with thousands in many larger states.
This demonstrates an important principle:
A state can have a strong education system because of decades of social investment, not because of one government programme.
Kerala’s educational advantage is cumulative.
Punjab’s recent progress, by contrast, is a useful example of how concentrated policy intervention can accelerate improvement.
India needs both models.
And then there is Uttar Pradesh
UP presents perhaps the biggest test for Indian education policy.
With more than 4.27 crore school students and more than 2.62 lakh schools, the scale is incomparable.
Its literacy rate is 78.2%, below India’s 80.9% average.
Its UDISE+ pupil-teacher ratio is around 26, and the state has 9,508 single-teacher schools serving more than 6.24 lakh students.
Yet there are also signs of improvement.
NITI Aayog’s analysis notes that several states, including Uttar Pradesh, have recorded substantial improvements in learning indicators in recent years. ASER 2024 also identified Uttar Pradesh among states showing notable improvements in government-school reading levels.
This is why simplistic “good state/bad state” rankings can be misleading.
UP’s challenge is partly one of scale.
What works in a state with 15,000 schools cannot simply be copied into a system with more than 2.6 lakh schools.
Bihar, Madhya Pradesh and Rajasthan: the difficult end of the spectrum
The literacy figures tell their own story:
- Bihar – 74.3%
- Madhya Pradesh – 75.2%
- Rajasthan – 75.8%
- Jharkhand – 76.7%
- Uttar Pradesh – 78.2%
All remain below the national average of 80.9%.
But the issue is not simply literacy.
Take teacher deployment.
UDISE+ 2024-25 reports:
- Bihar: 1,865 single-teacher schools
- Madhya Pradesh: 7,217
- Rajasthan: 6,117
- Jharkhand: 9,172
- Uttar Pradesh: 9,508.
Jharkhand’s overall pupil-teacher ratio is also 36, considerably higher than the national figure of 24.
The message is clear:
India does not have only a teacher shortage. It also has a teacher-distribution problem.
One school may have several teachers while another village school has one teacher managing multiple grades.
The uncomfortable truth: Government schools have been shrinking
This is where the “School Thik Karo” debate becomes important.
Government data show that the number of government schools fell from:
10,32,386 in 2021-22 → 10,16,010 in 2022-23 → 10,17,660 in 2023-24 → 10,13,322 in 2024-25.
An analysis of UDISE+ data therefore identifies a decline of 4,338 government schools between 2023-24 and 2024-25.
There is an important caveat here.
The Union government has repeatedly clarified that opening, closing and rationalisation of schools fall under the respective state governments and UT administrations, because education is in the Concurrent List.
And a falling school count does not necessarily mean that every closed school was functioning well and was simply abandoned. Some schools have very low or zero enrolment and may be merged or rationalised.
In fact, the Ministry’s data show that in 2024-25 there were more than 65,000 government schools with fewer than 10 students or zero enrolment, with approximately 1.44 lakh teachers attached to them. (
So the real policy question is not:
“Why are schools being closed?”
It is:
“Why are children leaving these schools in the first place?”
Why are parents moving towards private schools?
This is perhaps the most important question.
Parents don’t necessarily abandon government schools because they dislike public education.
They leave when they believe the private alternative offers:
- better English-language exposure
- more regular teaching
- stronger discipline
- better communication with parents
- more predictable academic outcomes
- better infrastructure
- greater confidence about their child’s future.
The perception itself becomes a vicious cycle.
Fewer children → fewer resources and teachers → weaker school environment → more parents leave → still fewer children.
Eventually the school becomes a candidate for merger or closure.
NITI Aayog’s 2026 report explicitly identifies increased dependency on private education systems and changing perceptions of government schools as a systemic challenge.
This is why merely repairing buildings is not enough.
The learning crisis is bigger than the infrastructure crisis
A shiny school building is useful.
But a smart classroom cannot replace a teacher.
A digital board cannot teach a child who cannot read.
A laboratory cannot compensate for weak foundational mathematics.
The ASER 2024 findings are revealing.
Among rural government-school students in Grade V:
- 44.8% could read a Grade II-level text.
- Only 26.5% could solve a three-digit-by-one-digit division problem.
There has been significant recovery since the post-Covid low, but the numbers still mean that a large proportion of children reach Grade V without mastering basic competencies.
That is the education emergency India must confront.
Why the “School Thik Karo” campaign is striking a chord
On 15 August 2026, Abhijeet Dipke launched the “School Thik Karo” campaign from Santuk Pimpri village in Hingoli, Maharashtra.
The campaign proposes a nationwide social audit of rural government schools, beginning with basic infrastructure and facilities.
Its political message is deliberately provocative:
If India can invest in prestigious national buildings and major infrastructure projects, why should a village school still struggle for basic facilities?
That question resonates because it moves the education debate from government announcements to the lived experience of children.
The campaign’s first school audit reportedly highlighted deficiencies in basic amenities, making the point that before discussing artificial intelligence, smart classrooms and global competitiveness, some schools still need the basics fixed.
And that explains why people are supporting the campaign.
They are not necessarily supporting a political party.
They are supporting a simple demand: inspect the school, document the problem, identify who is responsible and fix it.
That is essentially what social accountability should look like.
But “School Thik Karo” should go beyond walls and toilets
A genuinely successful school audit should measure at least five things:
1. The building
Is the roof safe?
Are classrooms usable?
Is there electricity?
Are toilets functional?
Is drinking water available?
Is there a boundary wall where necessary?
2. The teacher
How many sanctioned posts exist?
How many teachers are actually present?
How many vacancies remain?
How many schools have only one teacher?
3. The child
Can a Grade 3 child read?
Can a Grade 5 child understand a Grade 2 text?
Can students perform basic arithmetic?
Are children attending regularly?
4. The family
Why are parents choosing private schools?
Do parents participate in School Management Committees?
Are parents informed about their child’s learning level?
5. The outcome
What happens after one year?
Did reading improve?
Did mathematics improve?
Did attendance improve?
Did dropout fall?
That is the difference between a school inspection and a school transformation programme.
What should India do now?
NITI Aayog’s own 2026 report provides a useful roadmap. It recommends structural continuity, stronger infrastructure, better governance, stronger School Management Committees, improved teacher deployment and professional development, digital learning, foundational learning and greater community participation.
But the country needs to go further.
1. Stop treating school buildings as the final goal
Every school should have a publicly visible school report card.
Not a glossy brochure.
A simple dashboard showing:
Teachers | Attendance | Infrastructure | Learning | Dropout | Budget | Results
Parents should be able to see it.
2. Fix teacher distribution before merely increasing teacher numbers
India’s national pupil-teacher ratio may look comfortable at 24, but the existence of more than 1 lakh single-teacher schools shows why national averages can conceal local problems.
The priority should be:
Right teacher → right school → right subject → right time.
3. Make foundational literacy the national obsession
The most important school examination should not be Class 10.
It should be:
Can the child read, understand, calculate and reason by the end of primary school?
ASER and PARAKH already give policymakers powerful tools to answer this.
4. Reward states for improvement, not merely ranking
Punjab’s experience is important precisely because it suggests that a system can change.
But India should not create another race where states chase a rank.
Instead, states should be rewarded for:
- reducing learning gaps
- improving teacher attendance
- reducing dropout
- improving girls’ retention
- strengthening rural schools
- reducing single-teacher schools
- improving foundational learning.
5. Give School Management Committees real power
Parents should not be invited only for annual functions.
They should participate in:
- school planning
- infrastructure monitoring
- attendance review
- expenditure monitoring
- learning discussions.
This is where a campaign such as School Thik Karo can become particularly valuable: it can create public pressure while formal institutions convert that pressure into action.
India’s real education ranking
If we insist on ranking states, perhaps we should stop asking:
“Which state is No. 1?”
Instead ask five questions:
| Question | Possible leader/example |
|---|---|
| Who has the highest literacy? | Mizoram – 98.2% |
| Who has sustained literacy strength? | Kerala – 95.3% |
| Who is showing strong current foundational learning? | Punjab – 82% language, 78% mathematics in Grade 3 PARAKH 2024 |
| Who needs the greatest scale of intervention? | UP and other large, lower-performing states |
| What is India’s biggest systemic challenge? | Turning enrolment into actual learning |
The real lesson from Punjab
Punjab’s reported rise is politically contested in its attribution, but the underlying data are worth studying.
It demonstrates something important:
Government schools can change when governments treat them as a priority.
Kerala demonstrates something equally important:
Educational transformation cannot be built overnight; decades of social investment matter.
Mizoram demonstrates another lesson:
Small states can achieve extraordinary literacy outcomes.
UP demonstrates:
Scale changes the nature of the problem.
Bihar, Rajasthan, Madhya Pradesh and Jharkhand demonstrate:
India’s national average can hide enormous regional inequalities.
And the School Thik Karo campaign raises the question that perhaps should have been asked much earlier:
If government schools are the first classroom for millions of Indian children, why shouldn’t fixing them be treated as national infrastructure?
Because a school is infrastructure.
But unlike a road or bridge, it doesn’t merely connect places.
It connects a child to a future.
And India’s education policy for the next decade should be judged by one simple measure:
Not how many schools we build, not how many smart boards we install, and not which state wins a ranking—but how many children actually learn.
Sources & official reports
- NITI Aayog — School Education System in India: Temporal Analysis and Policy Roadmap for Quality Enhancement, 2026
- NITI Aayog — School Education Quality Index
- Ministry of Education — UDISE+ 2024-25
- Ministry of Statistics & Programme Implementation — PLFS 2023-24
- Lok Sabha — PLFS state-wise literacy data
- ASER Centre — ASER 2024 National Findings
- ASER Centre — ASER 2024 Full Report
- Lok Sabha — Government school closure data, December 2025
- Lok Sabha — Government school establishment/closure and single-teacher school data, February 2026
Data note: Literacy figures above refer to PLFS 2023-24 (July 2023–June 2024), persons aged 7+, rural + urban combined. School data primarily refer to UDISE+ 2024-25, while learning data use PARAKH 2024 and ASER 2024. These are different datasets measuring different dimensions of education and should not be treated as interchangeable rankings.

Leave a Comment